
-

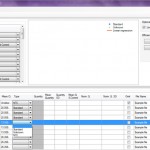
- Figure 1. Import generic files

-

- Figure 2. Main window with the quantity column

-

- Figure 3. Datagridview of assays

-
- Figure 4. Datagridview of samples

-
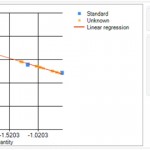
- Figure 5. Standard curve

-
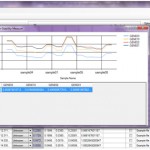
- Figure 6. Control Gene Stability analysis

-

- Figure 7. Results table

-

- Figure 8. Omit checkbox column

-
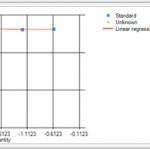
- Figure 10. Relative efficiency plot

-

- Figure 11. Inter-run coefficient of variation
